Webinar with EY: Data Insights from Virtual Events

Virtual Events 2.0: Responsive Tactics to MarComms Strategy:
Presenters can collect data from their event in real-time to better understand their audience through different means including Q&A, live polling, and feedback questions.
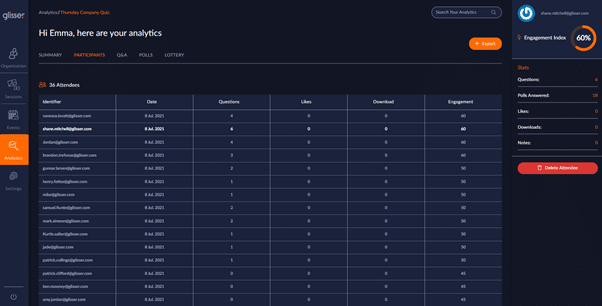
Using the data, the presenter can monitor and measure audience response using an in built engagement index. With this tool, presenters can not only measure participation from the audience, but attendance also, which can be used to determine the quality of data.
Glisser’s Engagement Index uses a secret algorithm to convert multiple forms of delegate participation into a single score out of 100. Use this to compare engagement levels across individuals, presentations and events.
The presenter can see how each participant has interacted with the session. You will be able to see how many questions the participant has asked, the number of slides they liked and whether they downloaded the slides. The data gathered from them generates an engagement score. By selecting the participants tab, the presenter is able to view every participant’s activity. This provides the presenter with valuable information, as all is recorded live at the event.
Individual participant data can be deleted from each of your sessions if you would like to remove staff members for example from the data set. This will remove all of the data associated with that participant.
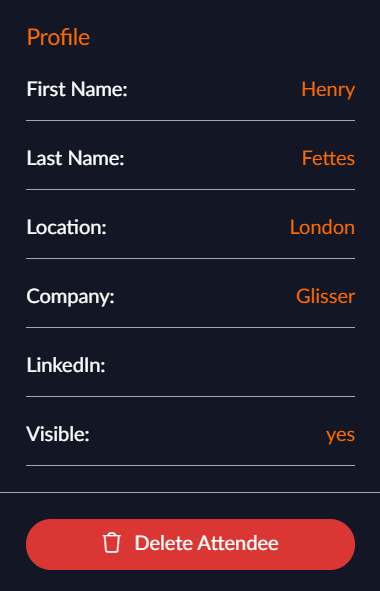
If you run a session or event using Attendee-2-Attendee connectivity, you will be able to access participant information for verified attendees.
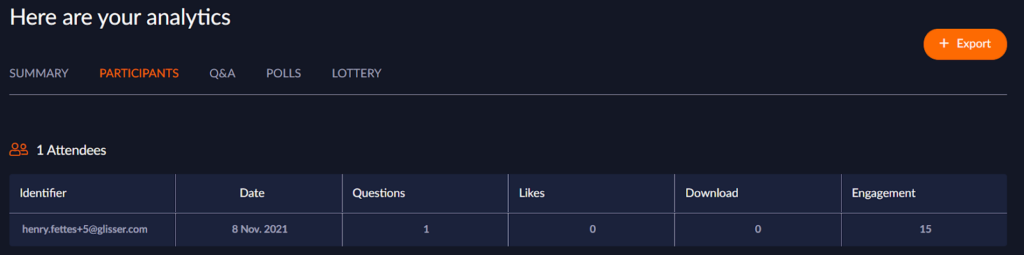
Click on their identifier email to access their profile:
On the Q&A panel, it is possible to not only see the questions asked, but to see who’s asked the question and how many upvotes that questions received. This can be valuable for providing responses to any questions which were not answered during the event.
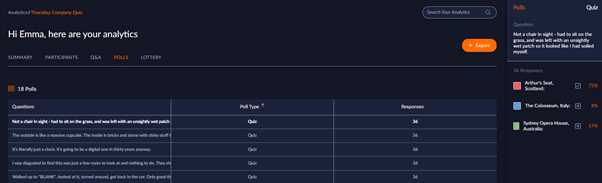
To view the responses to the polls, the presenter can select the polls tab. Here you can view the poll type and the number of responses. Additionally, the presenter can select the question, and view the answers in a simple pictorial format. Here you can also view the percentage of participants that selected each answer.
If you are using the Close Poll functionality you can now see which attendees missed polls due to closure, or if they chose to skip the polls.
Social includes the number of tweets that were received during your event. You may click on this to be redirected to Twitter.
For more information please see our support article on exporting your analytics.
If you used Glisser broadcast/Glisser Stream RTMP in your event – you will be able to access these recordings within the event analytics in the ‘video’ column. You will see the recording labelled with a ‘play’ button like so:
For more information on how you can use Glisser to increase attendance and reduce cost per attendee, please